
Revisions to historical GDP and employment estimates
Each year when Infometrics refreshes the Regional Economic Profile we add an extra year’s data and revise the historical employment and GDP series. We also revise the GDP time series in the first Quarterly Economic Monitor of the year which is published in late February.
There are multiple reasons for the revision of history. For some regions the various sources of revision can cancel each other out, resulting in very small revisions in GDP and employment. For other regions the sources of revisions can reinforce each other and result in larger revisions.
Some of the reasons our numbers are revised are outlined below.
Revisions to national GDP
Stats NZ frequently revises its historical GDP series. They may change their methodology for measuring GDP in a specific industry or get access to new information which improves their understanding of an industry. These revisions can sometimes be quite substantial and have flow on effects for each region. Sometimes the revisions can stretch back many years resulting in changes to our time series going far back.
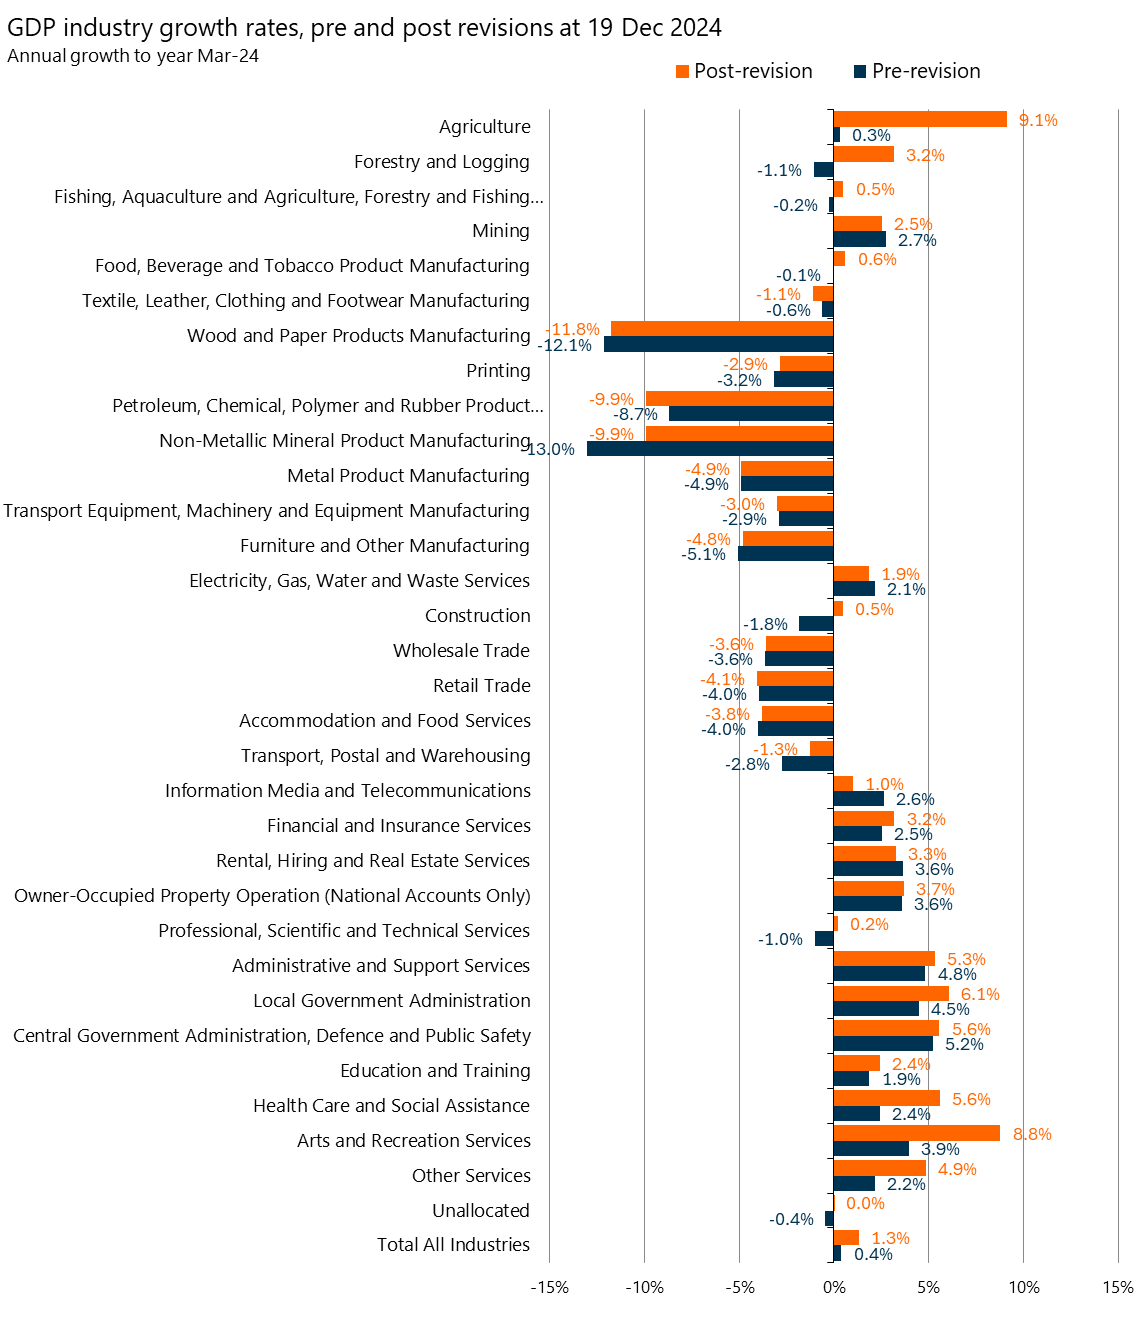
The chart below shows national GDP growth rates by industry for the year to March 2024 before and after the revision on 19 December 2024. The chart shows, for example, that Agriculture GDP growth was revised upwards from -0.3% to 8.7%. This means that territorial authorities with large rural economies have had their GDP growth rates revised upwards. There are also large upward revisions to health care and social assistance, and arts and recreation so territorial authorities with hospitals and large tourism sectors have been revised upwards.
Revisions to Linked Employer Employee Data (LEED)
Our regional employment and GDP models rely heavily on Quarterly LEED data. Each quarter when Stats NZ publish LEED data, they revise the last three quarters of data.
Stats NZ usually revises its self-employment count from Annual LEED two years back.
Replacement of Monthly Employment Indicator data with LEED
In addition to LEED data our models also use Monthly Employment Indicator (which has been transformed from being residence based to workplace based) data for the final two quarters of the employment and GDP time series. The following year when LEED data is available for those two quarters, we replace the MEI with LEED data which results in revisions to our numbers.
Change in price levels
Each year we revise our GDP series to be in constant prices from the latest year. The GDP series in the new Regional Economic Profile is in 2024 prices.